Updated March 2026. All tariff figures sourced from the WA Government and Synergy. This post is not financial advice.
As of 1 July 2025, the WA Government confirmed the Synergy Home Plan (A1) supply charge at 116.05 cents per day and the electricity charge at 32.3719 cents per kWh. These are the rates Perth households on the standard residential tariff are paying today.
That 2025 increase of 2.5% is the headline tariff movement, but it understates what actually happened to household bills. The WA Government simultaneously scrapped its $400 annual electricity credit, which had been applied automatically to every Synergy and Horizon Power residential bill since 2020. For most Perth households, the combined effect of the tariff rise and the removal of credit added several hundred dollars to their annual electricity costs in a single year.
Year | Supply charge (c/day) | Cost per kWh (c) |
|---|---|---|
2014 | 45.1516 c | 24.5961 c |
2015 | 47.1834 c | 25.7029 c |
2016 | 48.5989 c | 26.4740 c |
2017 (Supply charge doubled) | 94.9058 c | 26.4740 c |
2018 | 101.5490 c | 28.3273 c |
2019 | 103.3263 c | 28.8229 c |
2020 (COVID-19 relief freeze) | 103.3263 c | 28.8229 c |
2021 | 105.1400 c | 29.3273 c |
2022 | 107.7685 c | 30.0605 c |
2023 | 110.4600 c | 30.8120 c |
2024 | 113.2200 c | 31.5823 c |
2025 (confirmed, effective 1 July 2025 | 116.0500 c | 32.3719 c |
Source: WA Government, Energy Policy WA (1 July 2025). 2020 rates frozen — COVID-19 economic relief.
The chart above plots both components since 2014. Note the 2017 step: the supply charge nearly doubled in a single year while the unit rate remained flat, a structural repricing of network infrastructure costs that permanently reshaped the bill.
What that means on a bill
A Perth household consuming 25 kWh per day, a reasonable baseline for a home with reverse-cycle air conditioning, a fridge, a hot water system, and a typical accumulation of modern devices, pays a bi-monthly bill of approximately:
- 2014: $396
- 2025: $542
That is a $146 increase, or roughly 37%, over eleven years for the same consumption. The same amount of power per day in 2025 costs the average homeowner almost $2 more than in 2014, a $60 increase per month for the same electricity.
Projected bills to 2035
Applying a conservative 2.5% annual increase, in line with recent confirmed rates rather than the higher 2.7% historical average, and converting to a bi-monthly bill at 25 kWh/day:
Year | Grid-only bill | With 6.6 kW solar (60% utilisation) |
|---|---|---|
2025 (current) | $541.66 | ~ $222.00 |
2026 | $555.20 | $228.51 |
2027 | $569.08 | $234.37 |
2028 | $583.31 | $240.23 |
2029 | $597.89 | $246.24 |
2030 | $612.84 | $252.40 |
2031 | $628.16 | $258.71 |
2032 | $643.86 | $265.18 |
2033 | $659.96 | $271.81 |
2034 | $676.46 | $278.60 |
2035 | $693.37 | $285.57 |
Solar figures assume average daily production of 30 kWh, 60% self-consumption utilisation, and exclude DEBS (Distributed Energy Buyback Scheme) feed-in credits. This is a best-case linear projection — infrastructure cost spikes, as occurred in 2017, can significantly exceed the trend in any given year.
Bi-monthly bill based on 25 kWh/day consumption, 2.5% p.a. increase. Solar assumes 30 kWh/day average production, excludes DEBS credits.
Cumulative saving from 6.6 kW solar at 60% utilisation vs staying on grid only, 2025–2035. Excludes DEBS credits and system cost.
By 2035, at these rates, the difference between a grid-only household and a solar household at 60% utilisation is approximately $408 per bi-monthly bill cycle, before any DEBS credit for surplus exported to the grid.
Forces shaping the next decade
Understanding where rates are heading requires understanding what drives them. In 2026, several of those drivers have shifted compared to even two years ago.
- Grid expansion and industrial electrification: Perth's population continues to grow, but the bigger story is industrial-scale electrification. WA Government modelling suggests that if 7.2 GW of new industrial loads connect to the SWIS by 2042, total electricity demand could grow to five times the 2022 level, requiring almost ten times the current generation capacity. Every step of that transition involves investment in transmission infrastructure that flows through to the supply charge on household bills.
- Coal exits by 2029: WA's remaining coal generation, Collie and Muja C, is scheduled to close by 2027–2029, making WA one of the first states to fully exit coal. In the short term, this creates capacity risk requiring gas firming. In the medium term, it removes WA's primary exposure to global coal price volatility.
- A renewable milestone was reached: In November 2025, the SWIS hit a record 55.78% renewable energy contribution, the first time renewables accounted for the majority of the grid's energy. Average wholesale prices for major customers fell almost 30% that month as a direct result. WA Government modelling targets over 80% renewable generation on the SWIS by 2030, expanding to 96% by 2042. That trajectory is the strongest structural argument for rate stabilisation in the medium term.
Annual renewable energy share on WA's SWIS grid. 2025 figure is peak month record (November 2025: 55.78%). 2030+ are WA Government modelled targets. Sources: AEMO, WA Government SWIS Demand Assessment.
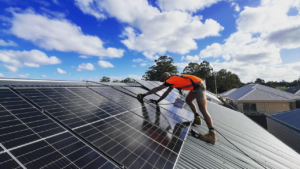
- Rooftop solar penetration: Perth suburbs have some of the highest rooftop solar adoption rates in the world, already driving daytime demand to record lows. This distributed generation is reshaping grid operations and reducing peak demand pressure during solar hours, with direct implications for network capacity investment requirements.
- Wholesale market exposure: Average energy prices in WA's Wholesale Electricity Market increased 11% in 2025, partly attributed to a record peak demand of 4,486 MW in January 2025. Gas and coal remain dominant generation fuels, and their prices respond to global supply and demand dynamics, including US trade policy uncertainty, LNG contract movements, and the pace of the coal-to-renewables transition.
- Skilled labour and inflation: The energy sector faces a structural deficit of qualified workers to operate and maintain a grid undergoing rapid transformation. That labour premium, combined with sustained input cost inflation across materials and maintenance contracts, has contributed directly to the supply charge trajectory seen since 2021.
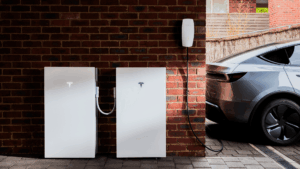
Opportunity: the battery rebate window
There are two rebate streams Perth (Synergy) households can stack. The state scheme is stable. The federal component is time-sensitive; the STC Factor steps down on 1 May 2026, then again every six months through to 2030
Incentive | Amount | Notes |
|---|---|---|
WA Residential Battery Scheme (Synergy) | Up to $1,300 | $130 per usable kWh, capped at 10 kWh. VPP enrolment required. Launched 1 July 2025. |
Federal Cheaper Home Batteries Program | ~$3,020 for a 10 kWh system (~$302/kWh) | Based on STC Factor 8.4 at ~$38–$40/STC spot. Applied as upfront discount at point of sale. STC price fluctuates, rebate value moves with market. |
Combined total: 10 kWh system, Synergy area | ~$4,320 | State + Federal stacked. No means test on either rebate. Correct figure for Perth (Synergy) customers . |
Interest-free loan (income <$210k) | Up to $10,000 | 3–10 year repayment, administered by Plenti. Separate from and stackable with the rebate. Means-tested; rebate itself is not means-tested. |
STC spot price at time of publication: approximately $39.65/certificate (Ecovantage market data, late March 2026). The federal rebate dollar value is not fixed — it moves with the live STC market. The figures above use ~$38 as a conservative midpoint estimate, net of typical transaction and administrative costs.
The Federal STC Factor used to calculate the Cheaper Home Batteries discount reduces from 1 May 2026, with further reductions every six months. Households acting before May 2026 access the higher federal component. From 1 May 2026, all new and upgraded systems on the SWIS must also comply with new Western Power technical standards.
💡 The combined rebate, falling DEBS feed-in rates, and rising grid tariffs create a case for the return on a solar and battery system being stronger in 2026 than in 2027.
DEBS: what your solar exports earn
The Distributed Energy Buyback Scheme pays 10 cents per kWh for electricity exported between 3pm–9pm, and 2 cents per kWh for all other hours. Since 2020, DEBS rates have decreased by over 30%. The direction is consistent: feed-in credits will continue to reduce as more rooftop solar saturates daytime supply.
The asymmetry matters for system design. Solar panels generate most strongly between 10am and 2pm, largely the 2c/kWh period. A battery captures that midday surplus and holds it for the 3pm–9pm window, where it either reduces grid imports (saving 32.37c/kWh) or exports at the higher DEBS rate. Self-consumption increasingly outperforms feed-in as the primary financial case for storage.
Electrification: a reframed bill conversation
There is a broader shift happening that makes this more than a conversation about the electricity line item on a household budget.
The arrival of an electric vehicle changes the household energy maths significantly. A car that previously consumed petrol now runs on electrons. For a typical Perth household driving 15,000 km per year, that transition adds roughly 2,500–3,000 kWh of annual electricity demand. On the standard grid tariff that is approximately $800–$970 per year in additional cost. Generated from a home solar system, that same travel costs close to nothing during daylight hours.
The electrification of transport, home heating, and cooking represents a structural increase in household electricity demand over the coming decade. Households that own their generation are insulated from that cost escalation in a way that grid-dependent households are not. Synergy’s EV Add-On tariff recognises this shift with lower overnight charging rates for EV customers, which can be combined with solar and battery storage to close the loop.
How many devices are in your home?
The supply charge funds the network. The unit rate funds the energy you consume. And household consumption has grown steadily as technology has become embedded in daily life.
Consider the energy-consuming devices in a typical Perth home: smartphones, tablets, televisions, computers, gaming consoles, a dishwasher, benchtop appliances (air fryers, Thermomix, microwave, kettle), power tools, battery garden tools, air conditioners, a pool or spa, smart home devices, an aquarium, reticulation pumps — and increasingly, an electric vehicle and home battery.
Almost none of the latter items existed in the average home ten years ago. A solar system with an energy monitoring dashboard makes that consumption visible and manageable, turning an invisible and rising cost into something you can measure, offset, and control in real time.
Key data for reference
All figures sourced from the WA Government and AEMO unless noted.
2025 supply charge (confirmed) | 116.05 c/day (effective 1 July 2025) |
|---|---|
2025 unit rate (confirmed) | 32.3719 c/kWh (effective 1 July 2025) |
2025 tariff increase | 2.5% |
$400 electricity credit | Removed July 2025 |
Avg. annual increase 2014–2025 | ~2.6% (tariff only) |
Bi-monthly bill, 25 kWh/day (2014) | $396 |
Bi-monthly bill, 25 kWh/day (2025) | $542 |
Projected bill, 2035 (grid only) | $693 at 2.5% p.a. |
Projected bill, 2035 (with solar) | $286 (6.6 kW, 60% utilisation) |
SWIS renewable share (Nov 2025) | 55.78% — first majority-renewables month on record |
WA coal exit target | Collie & Muja C closing 2027–2029 |
WA battery rebate (Synergy) | Up to $1,300 ($130/kWh, capped at 10 kWh). VPP enrolment required. |
Federal Cheaper Home Batteries — current (to 30 April 2026) | ~$3,020 for a 10 kWh system (~$302/kWh). STC Factor 8.4 at ~$38–$40/STC spot. |
Federal Cheaper Home Batteries — from 1 May 2026 | ~$2,520 for a 10 kWh system (~$252/kWh). STC Factor reduces to 6.8. |
Combined WA + Federal — 10 kWh system (Synergy, to 30 April 2026) | ~$4,320 |
Combined WA + Federal — 10 kWh system (Synergy, from 1 May 2026) | ~$3,820 |
DEBS rate — peak (3pm–9pm) | 10 c/kWh |
DEBS rate — all other times | 2 c/kWh |
DEBS off-peak rate decline since 2020 | 33% (3c at launch → 2c current) |
Federal battery STC factor change | Every 6 months from 1 May 2026 (previously annual) |
This post is updated annually. Projections use linear extrapolation of historical average increases and are not financial advice. Actual rates are set by the WA Government annually as part of the State Budget process.